")


Configuration
Start fSonar from Windows Menu: Start → All programs → fSonar → Configure NetFlow sensor. The fSonar window appears as shown in figure below.

The window contains a toolbar, where icons and the current status of the fSonar service are displayed. In the figure above the service status is Stopped. Descriptions of icons are listed in the table below.
| Icon | Name | Description |
 |
Start | Start of fSonar |
 |
Stop | Stop of fSonar |
 |
Settings | Settings of the service |
|
|
Activation | Creation of registration information, activation of service, view of the current parameters of an activation key |
|
|
About | Displays information about the program |


After you first start the program you should set the parameters of the service. Click on the Settings link. The Sensor configuration windows appears as shown in figure below.
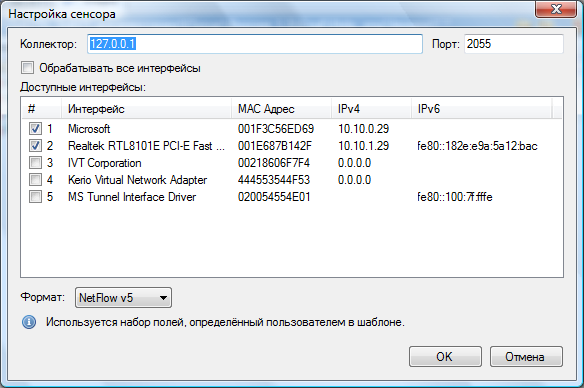
In the Collector box, type IP address of a computer, where NetFlow collector works, in IPv4 or IPv6 format.
In the Port box, type IP port number, which is used on the computer with NetFlow Collector.
In the Available interfaces table the list of available network interfaces on the computer with fSonar is displayed. The table contains the following columns:
- #;
- Interface;
- Physical address;
- IPv4;
- IPv6.
To select the required interfaces, check the box of appropriate row in the # column. If you wish to select all available interfaces, check on the Capture all interfaces box.
You can restrict the list of network packets, which will be processed, using a filter for a specific interface. Twice click on the required row of the table. The Network interface window appears as shown in figure below.
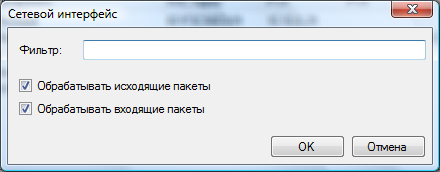
If you wish to process only outgoing packets, click on the Parse outgoing packets box.
If you wish to process only incoming packets, click on the Parse incoming packets box.
Type filter parameters in the Filter box. The capture filter syntax is the same as in tcpdump, Wireshark and others. Description of syntax you can see, for example, on the following page: http://www.tcpdump.org/tcpdump_man.html
If you want to collect specific data passing through a interface, we recommend to set a filter which will select only the required information. This will reduce the load on the processor and also on the interface through which flow data will send on a flow collector located on another computer of the network.
In the Sensor configuration window, select the required protocol:
- NetFlow v5,
- NetFlow v9.
In order to determine which protocol is best suited to you, you should review the list of fields that are supported by each of the protocols. It should be borne in mind that not all the fields specified for NetFlow version 9 supported (they are displayed in gray).
For NetFlow version 9 you can customize a template. This is a set of fields to be exported. NetFlow version 5 has a fixed set of fields, all of which are exported. To select the required fields, NetFlow version 9, select this protocol in the Format list and click on the Scheme button, which will lead to the appearance of the window shown in the figure below.
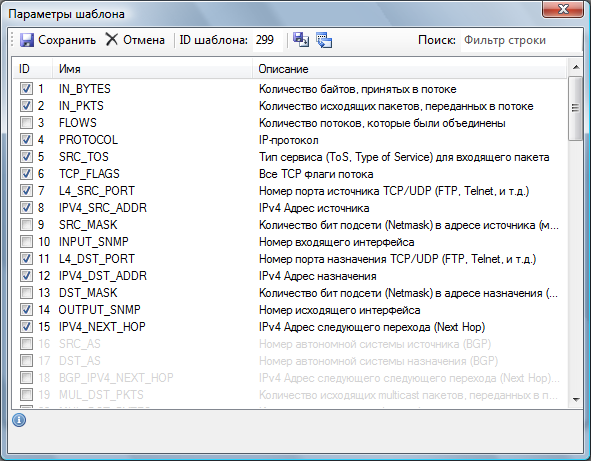
You can select the fields that should be present in the exported flow. To speed up the search for the required field, you can type the required word in the Search box. When you type characters in this box, records will be filtered that contain a set of typed characters. After you have selected the required fields, click on the Save button, which will ensure the continued use of this selected fields.
You can save a template in an external file for using this template in the future or on an other computer, for example, if you want to apply a specific field set on multiple computers. To do this, click on the Save options button, select the desired folder, and enter a file name.
If you want to apply a list of fields from a template file, click on the Load options button. Window opens, where you must select the desired file.
At this the program configuration is completed.
Starting and Stopping the Service
Click on the Start button for starting the service.
Click on the Stop button for stopping the service.
Managing the fSonar is also possible via the Services control of Windows, where it is called "fSonar sensor".
The window of the Configure NetFlow sensor program displays the service log. Displays the date and time of start / stop service fSonar, a list of interfaces on which NetFlow flow is generated, as well as errors that may occur during operation.